
To read a centrifugal pump curve, first confirm the speed, impeller diameter, liquid and units. Locate the required flow on the horizontal axis and read head from the matching performance curve. Then check efficiency, power, NPSH and the permitted operating region at that point. The installed flow is determined by the intersection with the system curve, not by selecting any attractive point on the catalogue chart. This guide uses illustrative examples and does not present an invented performance curve or assign unverified ratings to a Borra pump.
Read the conditions printed around the chart
A curve belongs to a particular pump configuration and test condition. Identify model, rotational speed, frequency, impeller diameter and test liquid. A chart may contain several impeller trims or speeds, so selecting the wrong line changes the result. Confirm whether the data describe a single pump, a family of pumps or parallel operation. Do not assume every curve beside a product photograph applies to the offered model.
Check flow units and head units before making a comparison. Litres per second, cubic metres per hour and US gallons per minute are not interchangeable numbers. A pressure scale also depends on liquid density when translated to head. Note whether power is shaft power or electrical input; mixing these definitions can create a misleading efficiency or motor calculation.
ال Borra IS clean-water centrifugal pump is a relevant product family for water-transfer duties. Request the selected model’s actual curve and documented operating conditions. The public product image or a general capacity statement should not be treated as a substitute for that selection evidence.
Find flow and head on the same curve
On a typical centrifugal chart, flow is horizontal and head is vertical. Move vertically from the required flow until reaching the line for the chosen speed and impeller. Read the corresponding head. That pair describes the pump’s performance under the stated conditions, but it does not establish that the connected system will operate there.
At zero flow, the curve indicates shutoff head under its test conditions. That is different from useful head at the required operating flow. A specification based only on maximum head may identify a pump that cannot deliver the desired quantity. Likewise, maximum free-discharge flow says little about performance through a long rising main.
Use the complete pump and system review to find installed duty. The pump duty-point guide covers that intersection separately. A curve-reading task is about understanding the chart; a selection task must also define the actual resistance and operating cases.
Interpret efficiency and best efficiency point
Efficiency indicates how effectively the pump converts supplied shaft power into hydraulic output under the stated conditions. The best efficiency point, or BEP, is the point of highest pump efficiency on the relevant curve. It is useful when comparing normal duty, but it is not the only acceptance criterion. Required flow, operating region, loading, suction conditions and process needs all matter.
Some charts show efficiency as separate traces; others show contours across a family of impeller curves. Read the correct efficiency at the selected flow and configuration. Do not apply the maximum efficiency printed anywhere on the chart to every operating point. A pump working far from that point can have very different efficiency and operating behavior.
The preferred and allowable operating regions should come from the manufacturer and applicable design guidance. They are not a universal percentage around BEP that can be invented for every pump. The Hydraulic Institute discussion of NPSH and operating regions explains why both suction margin and operating region deserve explicit attention.
Distinguish hydraulic power, shaft power and electrical input
Hydraulic power for an incompressible liquid is density multiplied by gravitational acceleration, flow and head. With flow in cubic metres per second and head in metres, the result is watts. Shaft power is greater because the pump has losses. Electrical input is greater again because the motor and other equipment also have losses. Use the exact definitions on the chart and quotation.
For an illustrative water duty, assume flow of 0.01 cubic metres per second and head of 20 m. Using water density of approximately 1,000 kilograms per cubic metre and gravitational acceleration of 9.81 metres per second squared gives about 1.96 kW of hydraulic power. If assumed pump efficiency is 70 percent, shaft power is about 2.80 kW. With an assumed 90 percent motor efficiency, electrical input is about 3.11 kW. These efficiencies are example inputs, not Borra data.
Motor selection must consider loading across the permitted range and the actual service conditions. Do not choose a motor solely from one example point. Verify the supplier’s complete power curve, electrical supply, starting arrangement and operating limits before accepting a size.
Read NPSH without confusing it with total head
NPSH describes suction-side pressure energy above the liquid’s vapor-pressure head. The pump’s required NPSH comes from its documented performance information, while available NPSH comes from the installation. They are different from the discharge head and cannot be replaced by reading the pressure gauge at the outlet.
Read the required value at the actual operating flow and speed. Establish whether the chart reports NPSH3 or another stated criterion. Merely matching available NPSH to the chart value does not guarantee freedom from cavitation; the application needs the appropriate margin. See NPSH available versus required for the system calculation and its assumptions.
When a selection changes to a different flow, speed or impeller, revisit both suction performance and the complete installed duty. Do not preserve a previous suction conclusion without checking whether the new curve and operating conditions alter the requirement.

Keep a chart-reading checklist beside the offer
| Chart item | سؤال لطرحه | Common misunderstanding |
|---|---|---|
| Conditions | Which speed, impeller and liquid apply? | Every line represents the offered pump |
| Flow and head | What pair occurs on the selected line? | Maximum head occurs at required flow |
| Efficiency | What efficiency applies at the duty? | Peak efficiency applies everywhere |
| Power | Is this shaft power or electrical input? | Motor nameplate equals operating consumption |
| NPSH | What criterion and flow apply? | Equality guarantees no cavitation |
| Operating region | Where is continuous operation permitted? | Any point on the chart is acceptable |
The checklist contains interpretation questions, not numerical pump ratings. The DOE pump-system resources provide background on matching pumps to the installed system and evaluating operating performance.
Review changing system conditions
A system curve includes static requirements and flow-dependent losses. Moving the wet-well level, changing outlet pressure, closing a valve or adding pipe can move the operating point. A chart-reading exercise that ignores those changes may identify only one possible condition. Specify the normal and credible extreme cases and check them against the selected pump’s limits.
Variable-speed operation needs curves or verified selection information for the intended speeds. Affinity relationships can help understand trends, but their application has assumptions and does not replace supplier verification of efficiency, loading and operating limits. A system with substantial static head may not respond to speed reduction as a simple proportional-flow estimate suggests.
For parallel pumps, build the combined curve by adding flow at a common head before intersecting it with the system curve. Do not simply double a single operating-point flow. Check each single-pump case as well as combined operation, especially where standby capacity is part of the station’s requirement.
Confirm the curve during commissioning
Record the supplied model and hydraulic configuration. Measure installed flow and relevant pressure or head conditions using suitable instruments and a defined method. Include liquid levels, valve position and speed in the test record. A pump cannot be compared meaningfully with its curve if these conditions are unknown or different from the assumed test setup.
If measured performance differs, inspect instrumentation, route assumptions, valve position, air, suction conditions and mechanical condition. Do not immediately conclude the supplier’s curve is wrong. Keep the final record as a baseline for later wear or system changes. The water-transfer troubleshooting guide addresses diagnosis after performance changes.
Keep a marked copy of the selected chart
Retain the exact chart version used for approval and mark normal and extreme duty cases on a copy. Include the speed, impeller and liquid conditions beside those marks. When a later quotation proposes a substitute, compare it with that record instead of reconstructing the original selection from a motor plate. A dated chart also prevents a family brochure or revised curve from being mistaken for the performance information that supported the installed equipment.
For the wider water-transfer selection, use the end-suction pump guide alongside this specific calculation or construction review.
الأسئلة الشائعة
Can I select from maximum head and maximum flow?
No. Those are different points or limits on a curve. Confirm the head available at the required flow and the installed intersection with the system curve, then review the remaining performance limits.
Is BEP always the required operating point?
No. BEP helps assess efficiency and operation, but the system demand must still be met. Use the manufacturer’s permitted region and check the expected range of operating conditions.
Why are two curves for the same model different?
They may use different speeds, impeller diameters, test liquids, units or configurations. Confirm those conditions before comparing performance or assuming the data conflict.
What should I send to a supplier for verification?
Provide the required flow, calculated head, liquid properties, suction conditions, operating range and electrical supply. Ask the supplier to mark the selected duty on the correct curve and identify the applicable limits.
التعلم المستمر
This NPTEL educational lecture explains centrifugal pump characteristics used in the hydraulic selection above. It does not verify a Borra rating or replace the selected model curve.
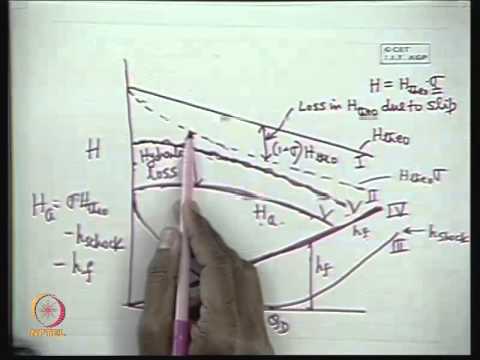
Watch nptelhrd: Mod-01 Lec-15 Characteristics of a Centrifugal Pump